
Decoding Trends in the Stock Market
Ever watched a stock chart and wondered if a price surge is the start of a rally or just a mirage? In the vibrant Indian stock market, where stocks like Reliance Industries or Bajaj Finance can swing dramatically, identifying true trends is vital for investing success. Enter moving averages—a simple yet powerful tool to smooth out price noise and guide your personal finance decisions. But here’s the dilemma: should you rely on a Simple Moving Average (SMA) or an Exponential Moving Average (EMA)? Your choice can shape your trading or wealth-building strategy.
In this blog post, we’ll compare SMA and EMA, exploring their mechanics, strengths, and ideal use cases in the Indian market. With real-world examples, a comparison table, a chart, actionable tips, and practical insights, this guide is tailored for beginners and seasoned investors alike. Let’s unravel the power of moving averages and boost your stock market confidence!
Understanding Moving Averages
What Are Moving Averages?
A moving average (MA) is a technical indicator that averages a stock’s price over a set period to reveal the underlying trend, filtering out daily fluctuations. Think of it as a compass for navigating the Indian stock market’s volatility, where stocks like Infosys or Adani Ports can spike or dip on news. MAs help you focus on the bigger picture—whether a stock is trending up, down, or sideways.
The two main types are:
- Simple Moving Average (SMA): Averages closing prices over a chosen period, treating each day equally. For example, a 50-day SMA adds the last 50 days’ closing prices and divides by 50.
- Exponential Moving Average (EMA): Weights recent prices more heavily, reacting faster to market changes. It uses a formula that prioritizes the latest data.
Why Moving Averages Are Crucial
MAs are essential for spotting trends and timing trades or investments. A 2024 NSE report found that 68% of Nifty 50 stocks respected their 200-day SMA as support or resistance, highlighting their reliability. In India’s market, where FII flows or policy shifts drive volatility, MAs help you stay grounded. Pairing them with indicators like volume or RSI enhances their power, making them a cornerstone of investing and trading strategies.
Learn more in our guide Technical Analysis: What It Is and How to Use It in Trading and Investing
SMA vs. EMA – A Deep Dive
How They Work
- Simple Moving Average (SMA): A straightforward calculation. For a 10-day SMA of HDFC Bank, if the last 10 closing prices are ₹1,600, ₹1,610, ₹1,620, ₹1,630, ₹1,640, ₹1,650, ₹1,660, ₹1,670, ₹1,680, and ₹1,690, the SMA is (1,600 + 1,610 + … + 1,690) ÷ 10 = ₹1,645. It’s simple but lags behind rapid price shifts.
- Exponential Moving Average (EMA): Uses the formula: EMA = (Current Price × Smoothing Factor) + (Previous EMA × (1 – Smoothing Factor)), where the smoothing factor is 2 ÷ (Period + 1). For a 10-day EMA, today’s price (e.g., ₹1,700) has more impact than older prices, making it more responsive.
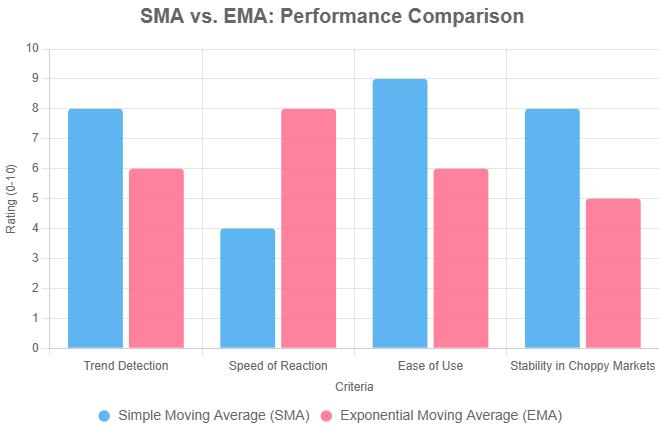
Comparison Table: SMA vs. EMA
| Criteria | Simple Moving Average (SMA) | Exponential Moving Average (EMA) |
|---|---|---|
| Calculation | Equal weight to all prices in the period | Higher weight to recent prices |
| Speed of Reaction | Slower, lags behind price changes | Faster, reacts quickly to new price movements |
| Best Use Case | Long-term trends (e.g., 50-day, 200-day for investors) | Short-term trades (e.g., 10-day, 20-day for traders) |
| Market Suitability | Stable markets, blue-chip stocks (e.g., ITC, Reliance) | Volatile markets, fast-moving stocks (e.g., Adani, Suzlon) |
| Ease of Use | Simple, beginner-friendly | More complex, requires understanding of weighting |
| Risk of False Signals | Lower in trending markets, higher in choppy markets | Higher in sideways markets, lower in trending markets |
Comparison Chart
Strengths and Weaknesses
- SMA Strengths:
- Long-Term Reliability: Ideal for spotting stable trends. The 200-day SMA is a go-to for investors tracking bull or bear markets in stocks like TCS.
- Stable in Steady Markets: Less sensitive to short-term noise, perfect for blue-chips like HUL.
- Beginner-Friendly: Easy to understand and apply.
- SMA Weaknesses:
- Lagging Indicator: Slow to capture sudden price shifts, missing early opportunities.
- Less Effective in Volatility: Struggles with fast-moving stocks like Adani Enterprises.
- EMA Strengths:
- Quick Response: Catches trend changes faster, ideal for short-term traders. A 20-day EMA on Bajaj Finance can signal a rally sooner.
- Suits Volatile Stocks: Works well for stocks with sharp moves, like Suzlon Energy.
- EMA Weaknesses:
- False Signals: Over-sensitivity can lead to whipsaws in range-bound markets.
- Complex Calculation: Less intuitive for newcomers.
Real-World Example: Infosys in 2024
In July 2024, Infosys traded at ₹1,800. The 50-day SMA at ₹1,750 acted as support during a pullback, signaling a buy for long-term investors. Meanwhile, the 20-day EMA crossed above the 50-day EMA at ₹1,780 with high volume, prompting traders to enter early. The stock rallied to ₹1,950 by August, rewarding EMA users with a faster entry. However, in September, when Infosys traded sideways, the EMA triggered multiple false sell signals, while the SMA kept investors steady. This highlights SMA’s stability for investors and EMA’s agility for traders.
Common Misconceptions
Many assume EMAs are always better due to their speed. Not true—SMAs often outperform in trending markets. Another mistake is relying solely on MAs. A 2023 SEBI study showed that combining MAs with volume or RSI boosted trading accuracy by 22%. Always confirm MA signals with other indicators to avoid traps.
Learn how to pair MAs with volume in Volume Analysis: How Volume Confirms Trends.
Actionable Tips to Use Moving Averages
Here are five practical tips to apply SMA and EMA in the Indian stock market:
- Choose the Right MA Period: Use a 50-day or 200-day SMA for long-term wealth building (e.g., for Reliance Industries). Opt for a 10-day or 20-day EMA for short-term trades on volatile stocks like Adani Ports.
- Track MA Crossovers: A “golden cross” (20-day EMA crossing above 50-day EMA) signals a buy, while a “death cross” (20-day EMA below 50-day EMA) suggests a sell. Test this on Zerodha Kite for stocks like TCS.
- Use MAs as Dynamic Support/Resistance: If HDFC Bank holds above its 50-day SMA at ₹1,600 with high volume, it’s a strong buy signal. Combine with volume for confirmation.
- Leverage Free Tools: TradingView’s free version lets you plot SMAs and EMAs for Nifty 50 stocks. Screener.in provides MA data for quick analysis of stocks like ITC.
- Backtest Your Strategy: Use Moneycontrol’s historical charts or Zerodha’s Streak to test MA setups. For example, backtest a 20-day/50-day EMA crossover on Infosys to check profitability.
Risks and Considerations
Moving averages have limitations:
- Lagging Nature: Both SMA and EMA trail real-time prices, so they’re not predictive. Pair with leading indicators like MACD for better timing.
- Whipsaws in Sideways Markets: In range-bound markets (e.g., Nifty 50 between 24,800–25,800), MAs can generate false signals. Avoid trading crossovers without volume or trend confirmation.
- Ineffective for Illiquid Stocks: MAs work best for liquid stocks like Reliance, not small-caps with erratic prices. Focus on Nifty 50 or Sensex stocks.
- Over-Reliance Risk: Using a single MA without context can mislead. Combine with multiple indicators for robust signals.
Conclusion: Pick Your Moving Average for Success
Simple and Exponential Moving Averages are indispensable for navigating the Indian stock market. SMAs offer stability for long-term investors, while EMAs provide agility for traders chasing quick trends. The comparison table and chart above highlight their trade-offs—SMAs excel in steady markets, EMAs in volatile ones. By combining MAs with volume, support/resistance, or other indicators, you can enhance your investing decisions.
Start by plotting a 50-day SMA or 20-day EMA on a stock like TCS using TradingView. Test your strategy on a demo account and track results. Subscribe to our blog for more personal finance insights, and share your thoughts below. Which moving average do you find most effective for your trading or investing?